
Monthly Insights - August 2024
Engagement on the blog has decreased a bit in August. I think this is partly due to Gmail pushing the posts into a different folder; they have been ending up in my "Promotions" folder.
It’s time for last month's stats! Slightly late edition. PAX hit me a lot harder than I expected. I was wiped out the first day I was home, and I felt my energy was low the rest of the week as well. I am still working on The Future of the Fortress for this week, and I was only able to finish the patch notes news video yesterday. Technically, it’s a week late, so it got two patches' worth of content.
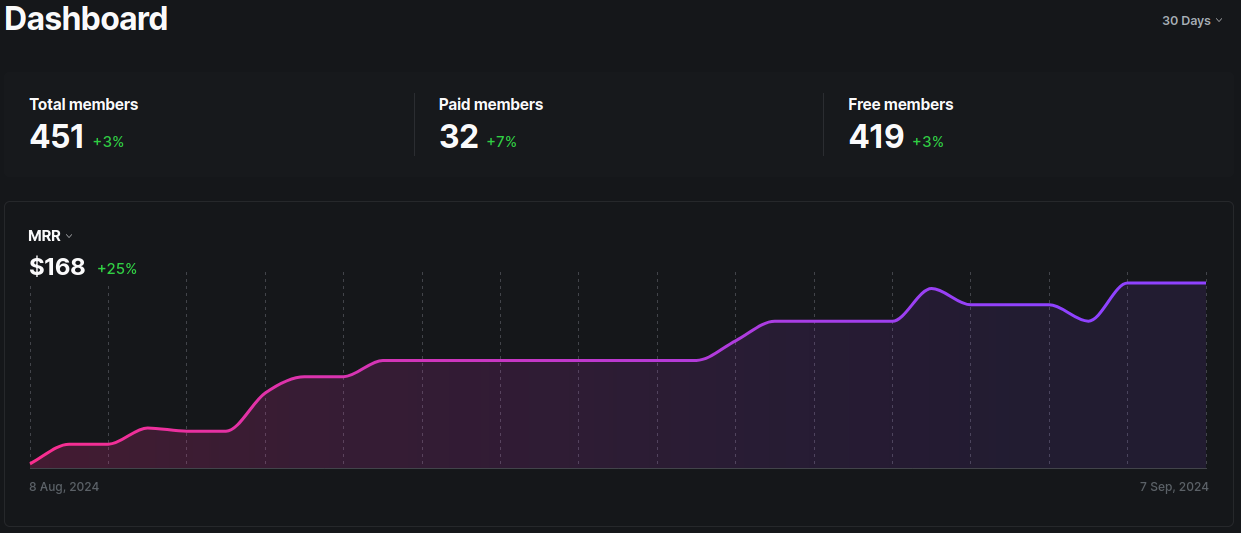
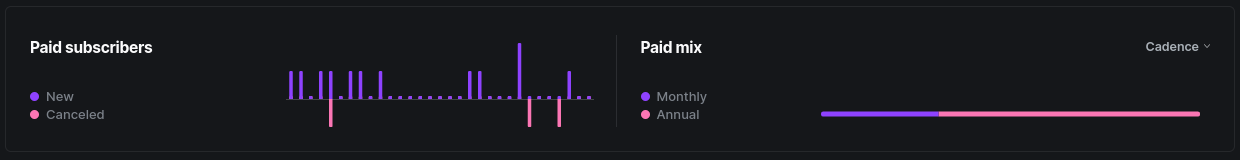
The blog itself is still climbing. Monthly income has jumped from $115 to $168. Keep in mind this is a combination of monthly and yearly figures. Below this text is an image that shows a purple and pink bar, with pink representing annual subscribers. Simply put, running this blog gave me a large cash injection in the first month, but it has tapered down to $30–$40 per month. It’s the annual renewals and new subscribers that give this blog jumps in revenue.
I feel like I'm not doing enough for the folks who support this blog. At the same time, I feel like I don’t quite have the mental space to do more. I need to come up with something because some of you are often covering more than your fair share of costs on the stream, and I want to give something back. I really enjoy writing these blogs and look forward to the weekly posts. I don’t think that just writing "more" would necessarily add much value. If you have any ideas, let me know in the comments section.
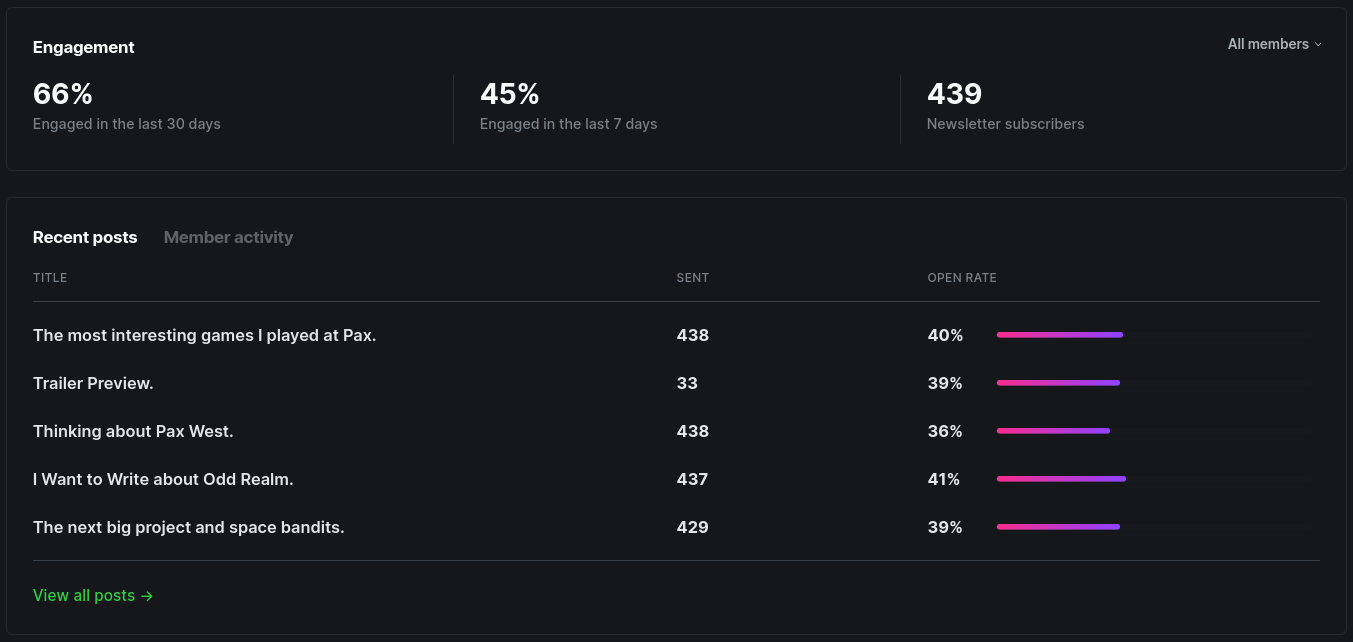
Engagement on the blog has decreased a bit in August. I think this is partly due to Gmail pushing the posts into a different folder; they have been ending up in my "Promotions" folder. I don’t think this is a huge issue, though, as it’s only email click-through rates. It’s also worth noting that my Google Analytics have shown growth.
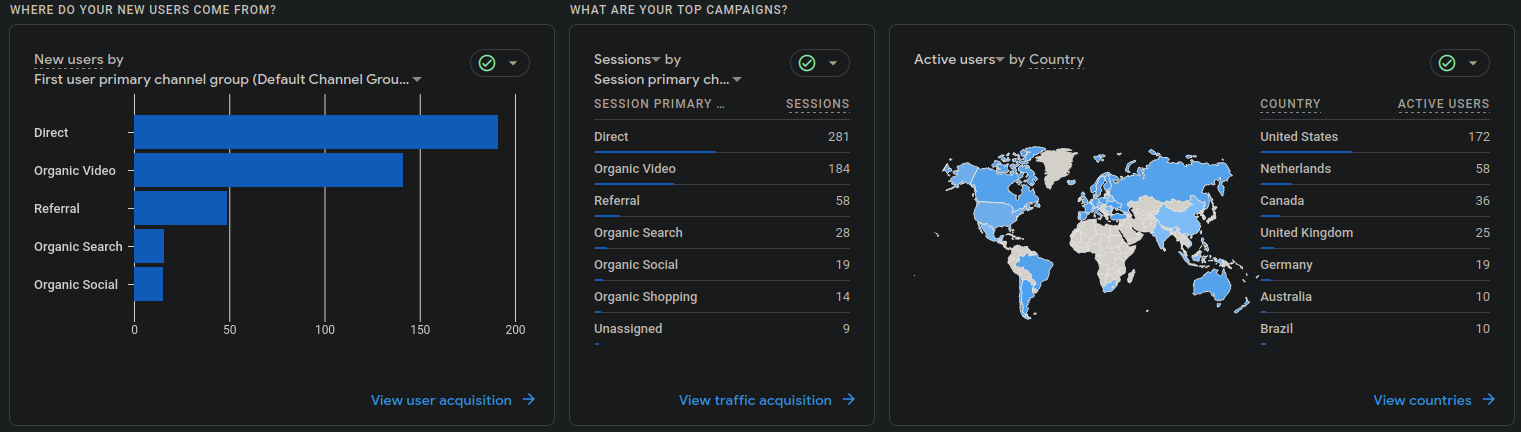
Overall, I am happy with the state of the blog. It’s getting good direct traffic from my existing channels, as well as a small amount of organic views. I still consider it my "side" project, as it allows me to create work in a totally different format. Thank you for helping to keep it funded and making it a viable use of my time rather than just a hobby. Hosting costs me $25 USD for up to 1,000 email subscribers. Right now, I’m at 439 email subscribers. I could have opted for the cheaper package of 500 email subscribers for $15 monthly, but I think it makes sense to jump the gun a little, as we’ll likely hit 500 by the end of the year. Growth is slow but steady.
Let's talk Twitch stats!
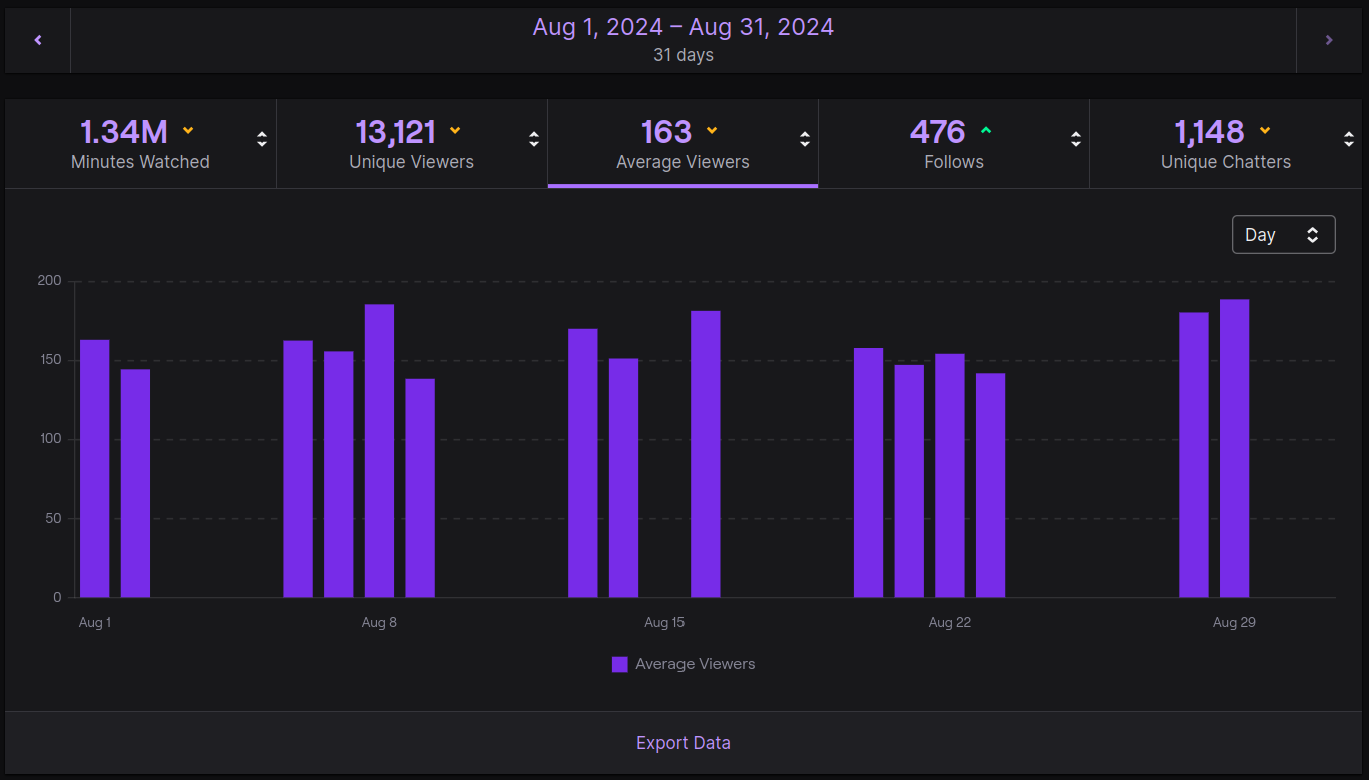
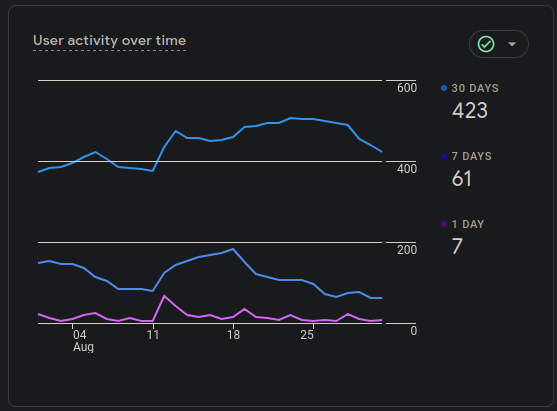
Things are generally down but still within the realm of safety. It has been a wild month on the YouTube side of things, so Twitch staying roughly the same is acceptable. With the shift in focus to larger videos performing well on YouTube, my Twitch followers have increased over July. I gained roughly 150 more followers than the month before. I have a feeling that as I build a library of recent popular videos, this trend could continue, which would be extremely beneficial for the future prospects of both channels.
Just for fun, I took a look at my emote usage both within and outside of my channel. I’m glad to say that the beer emote is still performing well around here. I had considered removing the panda emote a few times because it’s quite outdated in the context of the channel. For those who don’t know, it’s the desktop icon for RollerCoaster Tycoon 3, with some simple animations added on top. However, since we have plenty of slots available for more animated emotes, I see no problem with keeping it as a relic from the past. I’m also pleased to see that the Wambler is still popular and that Undulates seems to be well-loved.
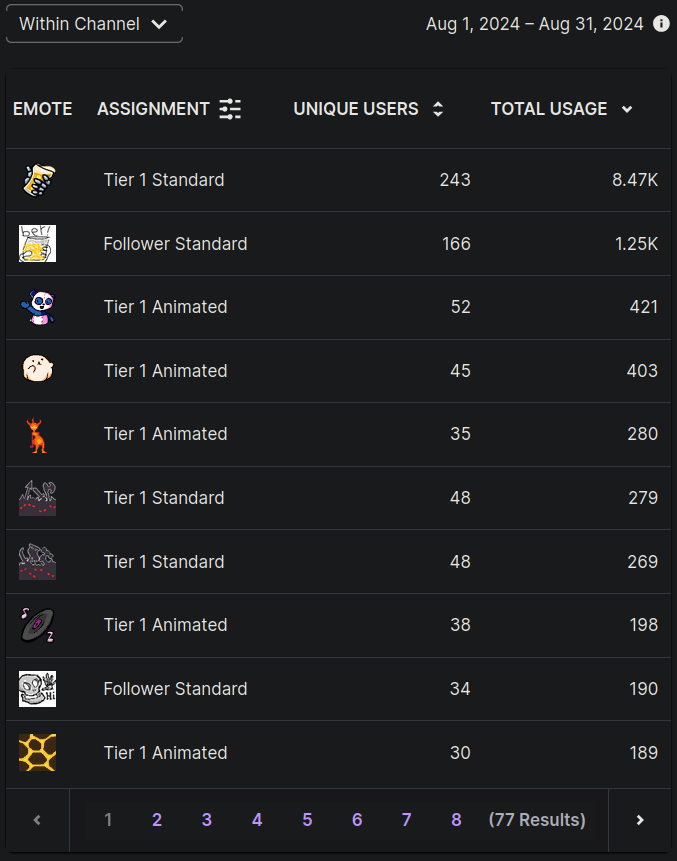
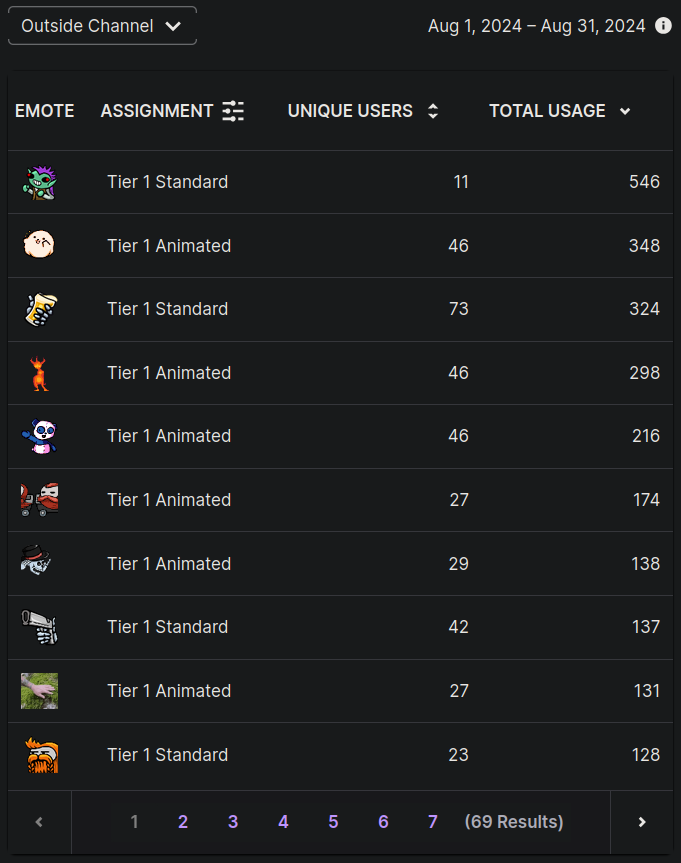
I’d like to have a word with those 11 people who seem to use the goblin emote with every line of text they type, especially in chats posted outside of my channel. I find it kind of hysterical how frequently the goblin emote is used, considering it’s not even in the top 10 within my channel itself. To be honest, I thought the moss emote would be higher on the list.
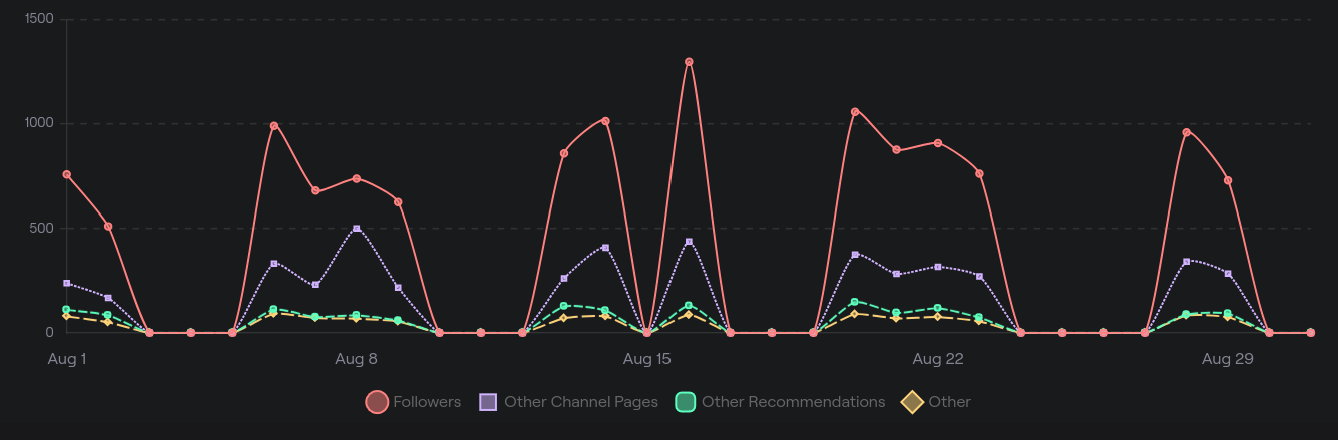
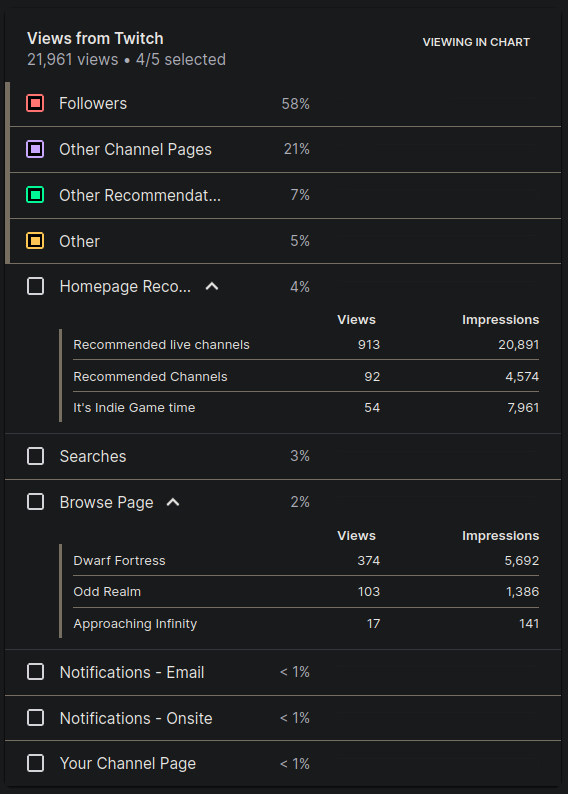
Alright, here is a more serious set of stats. This chart shows how viewers find my Twitch channel. The dots represent the days I streamed, and the legend explains what the graphs represent. "Other" refers to traffic from links, such as Discord and other forms of social media, which accounts for roughly 80 views per stream in my case. Below the chart is a detailed breakdown with percentage distributions of what the numbers mean.
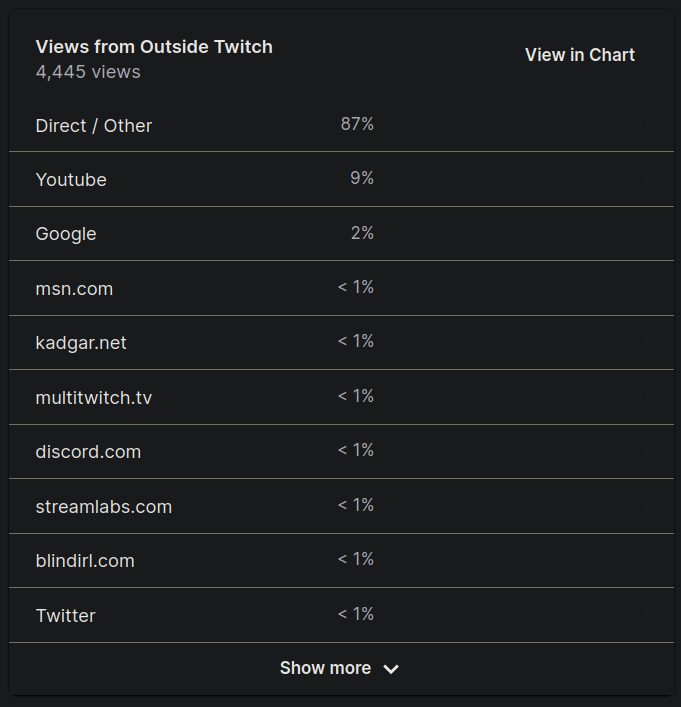
Views from outside of Twitch can be quite surprising. Even though it’s been a while since I’ve actively tweeted, I find it extremely funny that I’m getting more views from MSN. Like, how is that even happening?! Perhaps my goal for this blog should be to get more stream traffic from here than from MSN. I think we can do it..? COME ON, TEAM!
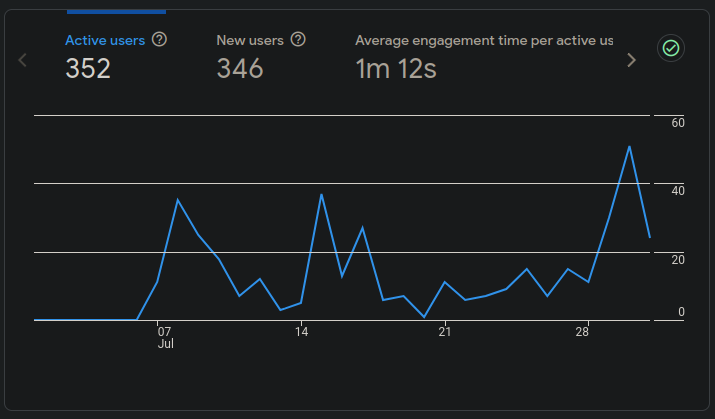
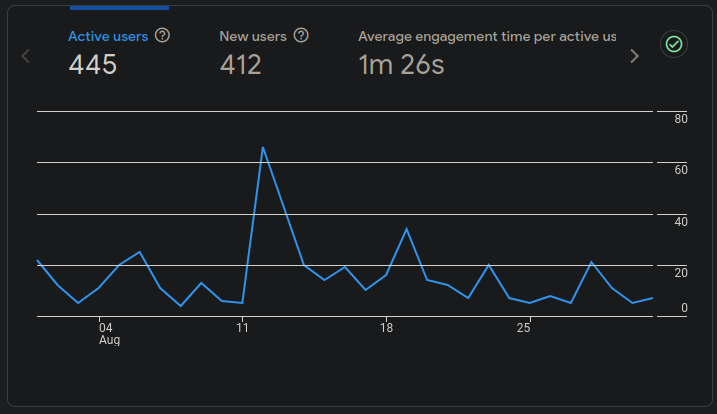
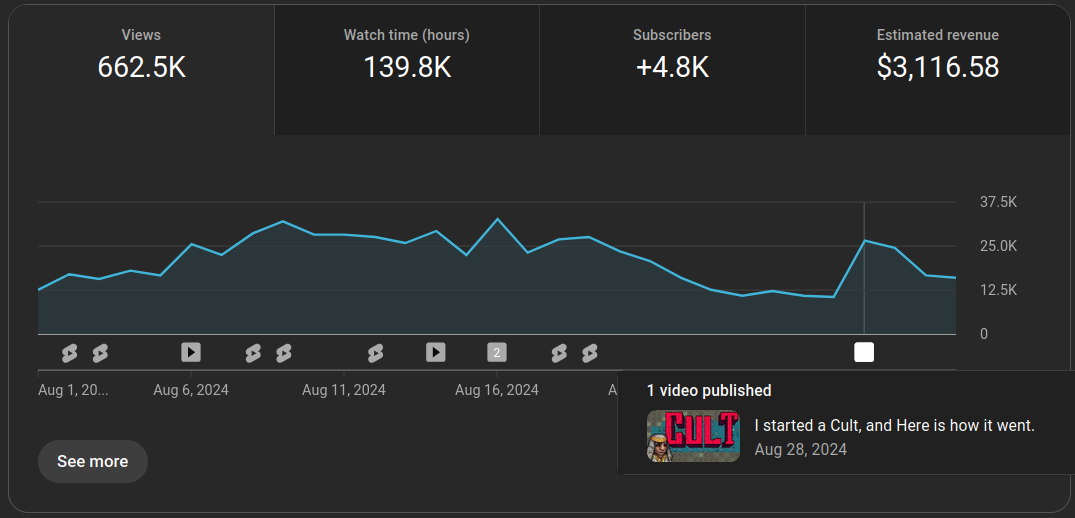
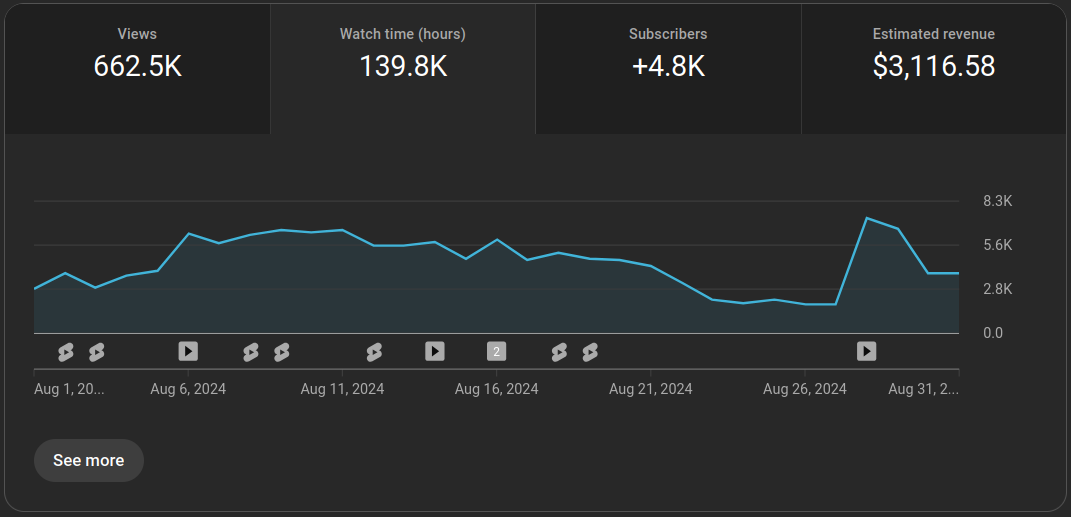
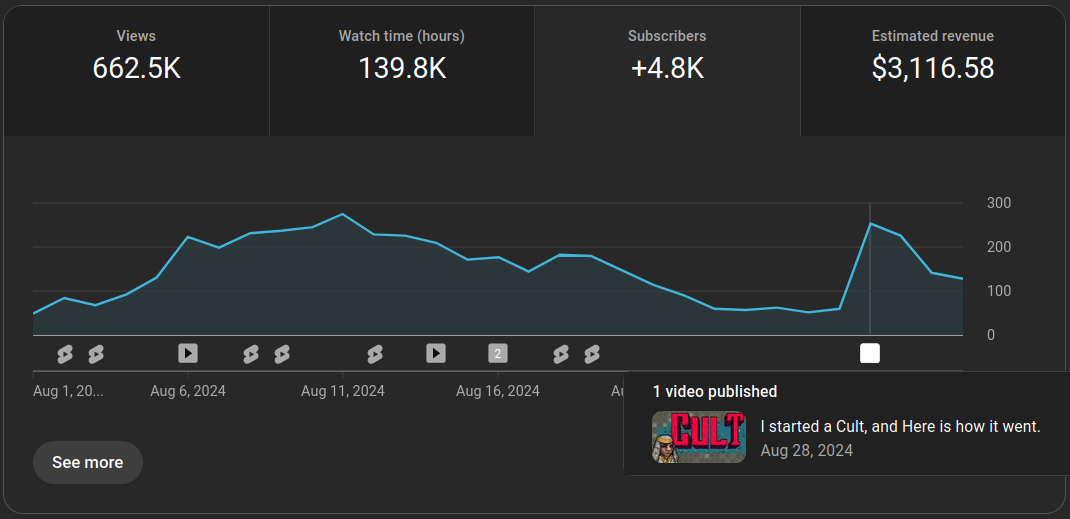
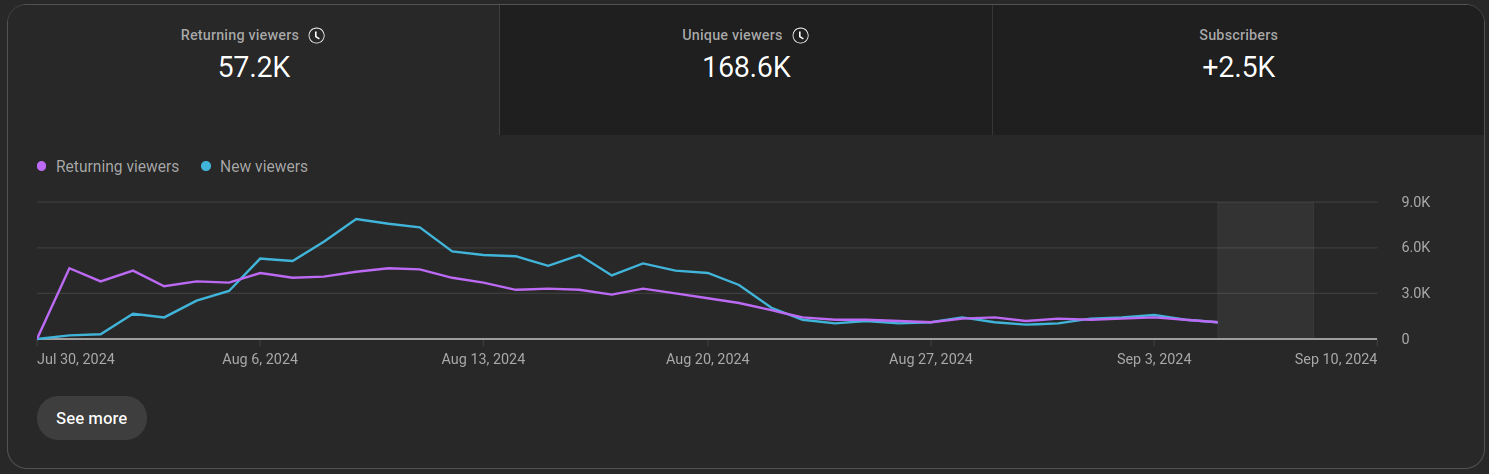
Let's move on to some stats from YouTube! We’ll first cover general channel stats and then delve into the stats for the last major video upload. The first thing I have to say is Hooo-ly Sh-eit! The first image in this gallery shows the last 28 days as of the time of writing. Everything following that is just for the month of August. The majority of the traffic in August is overflow from Godly Tombs. While Gore Tusk quickly gained traction when it was first uploaded, its viewership has dropped off much more rapidly. I attribute this to three things:
- The video has a significantly worse click-through rate from "New" viewers. This is mainly because the thumbnail animation shows the thumbnail for the previous video. In the future, if I link to an older video, I won’t full-screen the thumbnail in the video.
- It does not have as much of a mechanical pull, so retention was much worse. Godly Tombs had 70% of viewers still watching after the 30-second mark, while Gore Tusk is sitting at 52%.
- Godly Tombs took 4 days to hit 20k views and then started climbing rapidly. It received 8k views in the first 24 hours and 400 comments on that first day. Gore Tusk, despite getting 20k views in the first 16 hours, has been up for 10 days and has yet to break 400 comments.
Simply put, I’ve learned that mechanics are key in my videos. Gimmicks and mechanical explanations seem to perform better than just telling a story. Godly Tombs also fared much better with new viewer interest and retention. Gore Tusk has had a few bumps from the algorithm, but they don’t last very long, leading to a significantly faster drop-off compared to Godly Tombs.
Godly Tombs on the left. / Goretusk on the right.
To be clear, Godly Tombs might just be a lucky outlier, and Gore Tusk could represent the normal outcome. However, having achieved 250k+ views once, my goal now is to replicate that success rather than settling for 50k. Yes, the YouTube channel is performing at a significantly higher rate than before, which is a win regardless. But understanding what this new style of video needs to succeed is part of the growth process. For those who watched the video, Gore Tusk had good watch time and a great response from existing viewers. Not every video can be a runaway success, but they provide a chance to examine my style and make improvements that will help the videos perform better and grow the channel at a higher rate.
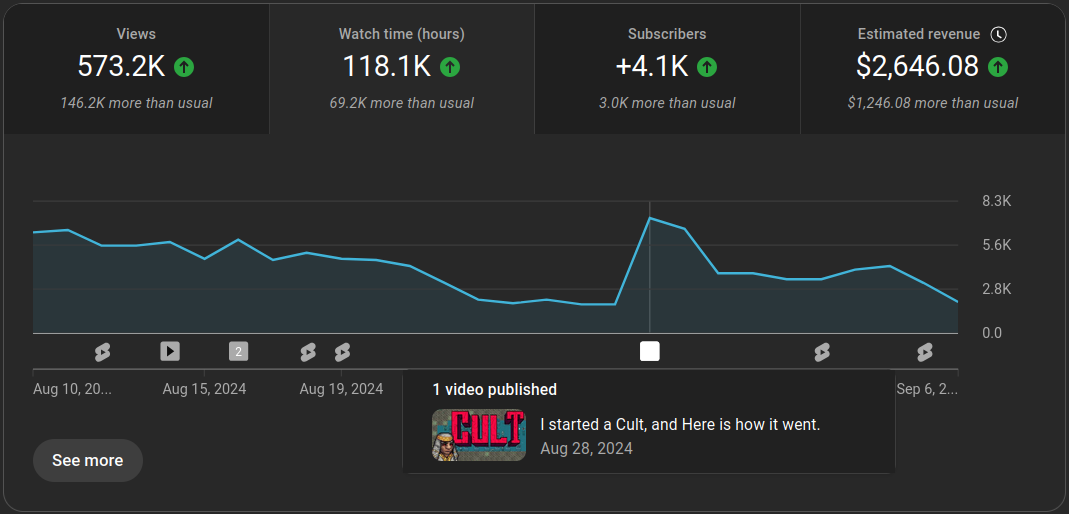
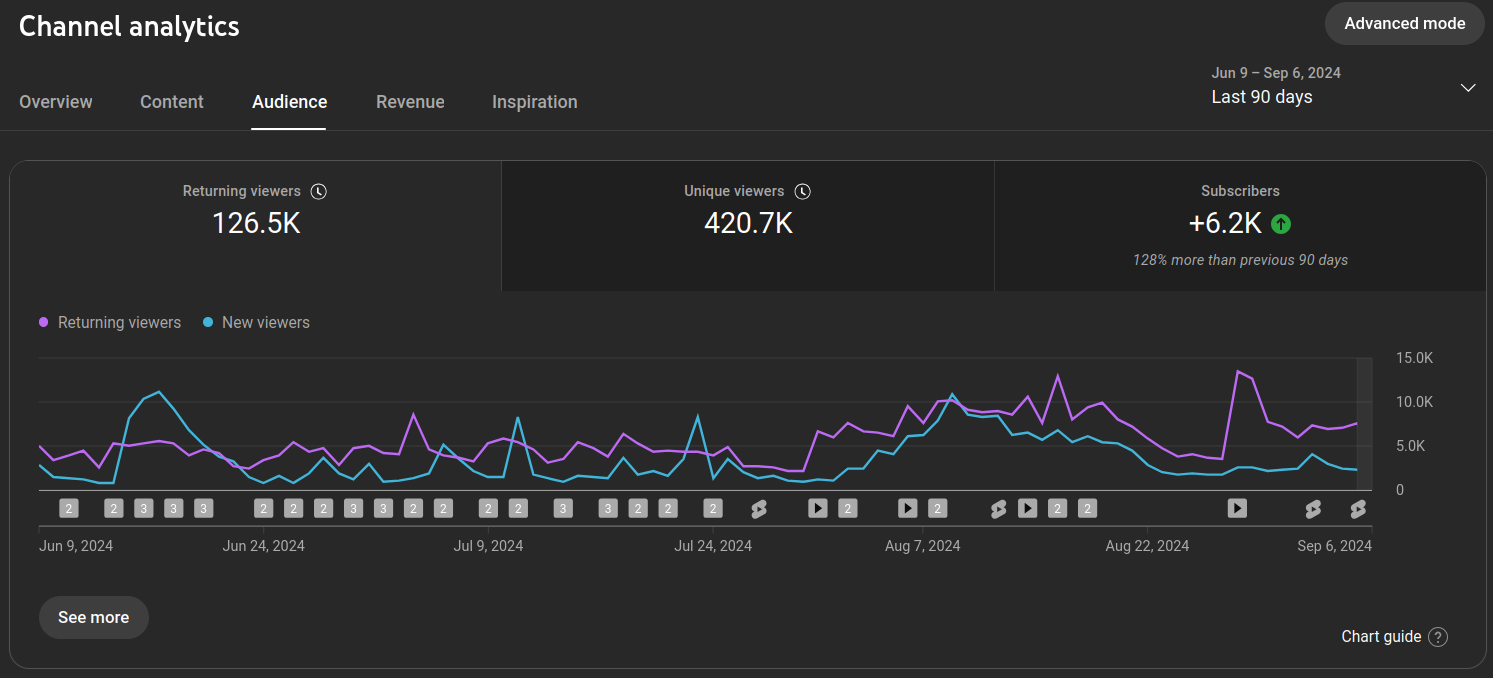
Let’s move on to some more general channel stats. Below is the overall audience data for the last 90 days. You can clearly see the significant impact that the new shift in style has had. That massive wave of blue since late July represents a huge increase in growth for the channel. It has surpassed the Adventure Mode Beta launch in April by tenfold, resulting in a +5.9K increase subscribers since July 4th. That’s when I announced that the content was going to change quite a bit. I’ll link that video at the bottom of this post.
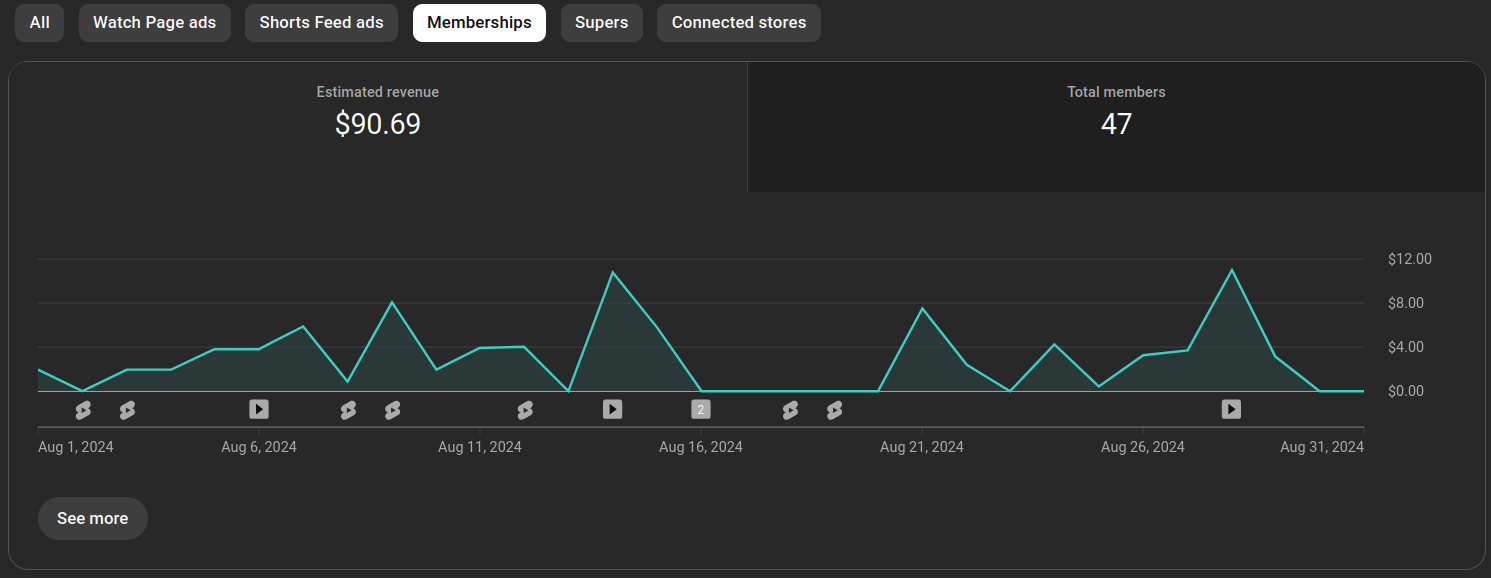
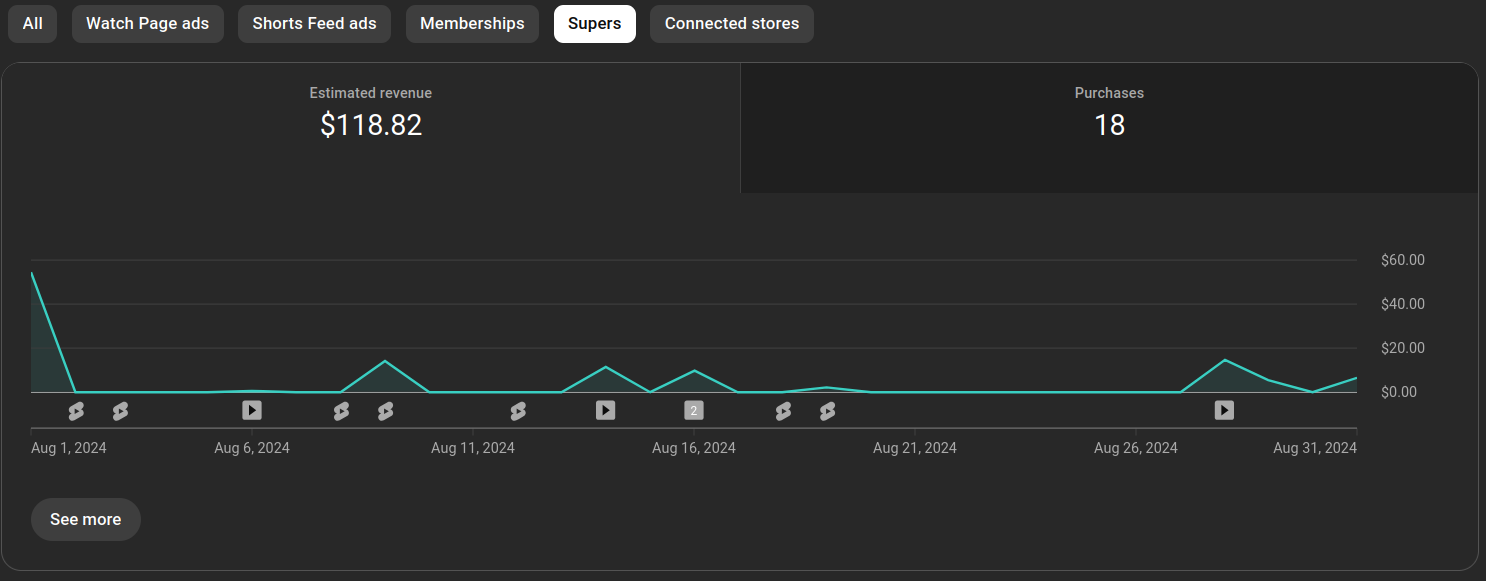
There’s always a bit of hesitation when it comes to sharing financial stats, but I believe it’s important to include them in these updates, so here it is. Please note that all amounts shown here from YouTube are in Canadian dollars and are before taxes. Last year, I paid roughly 21% in taxes, thanks to deductions and RRSP accounts.
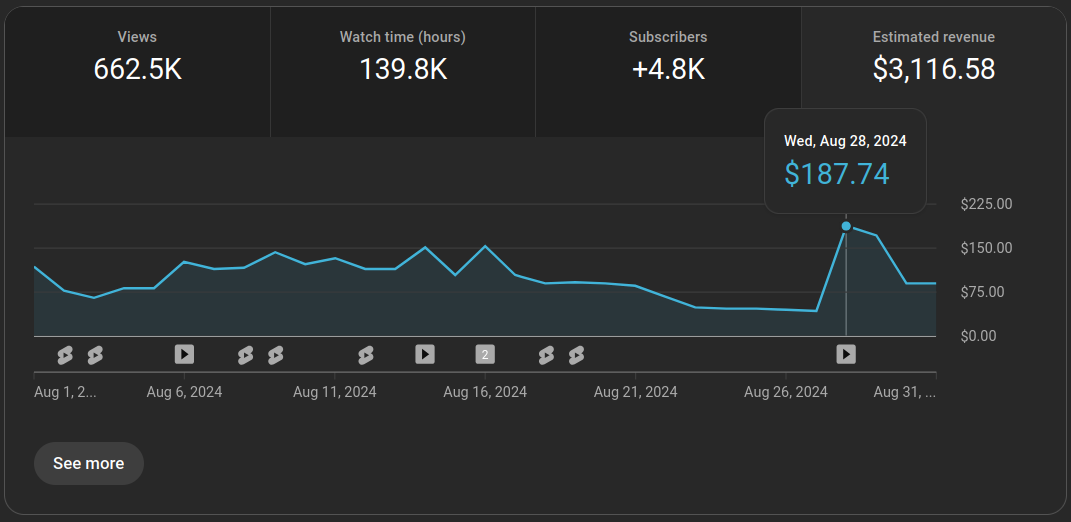
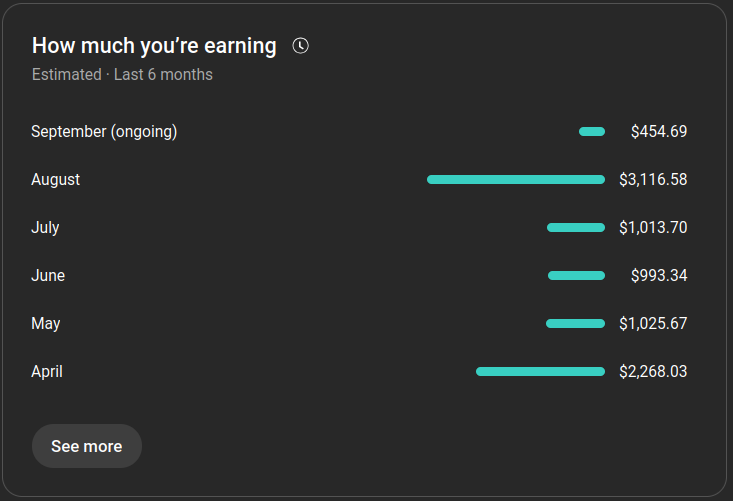
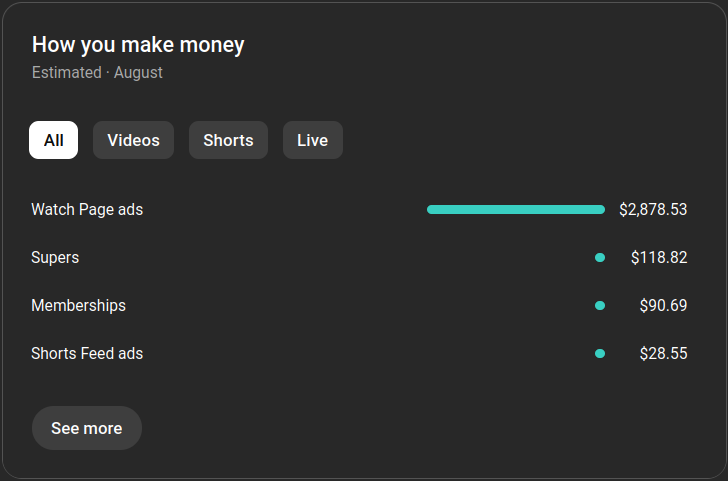
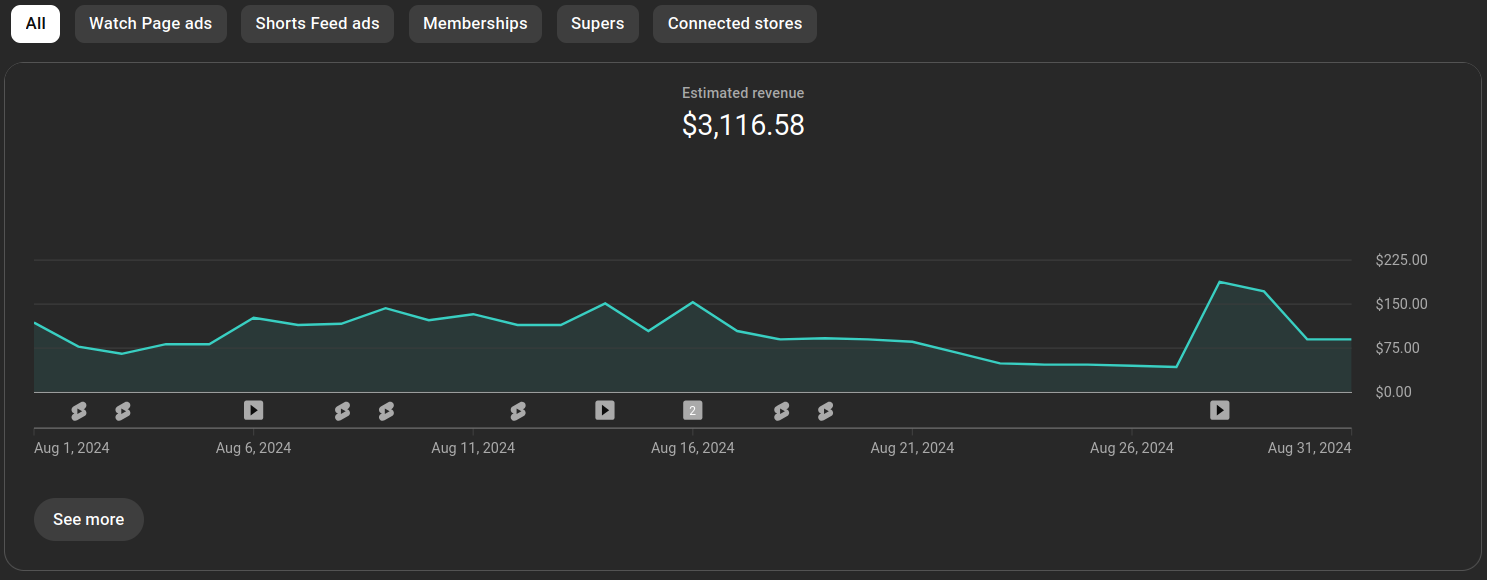
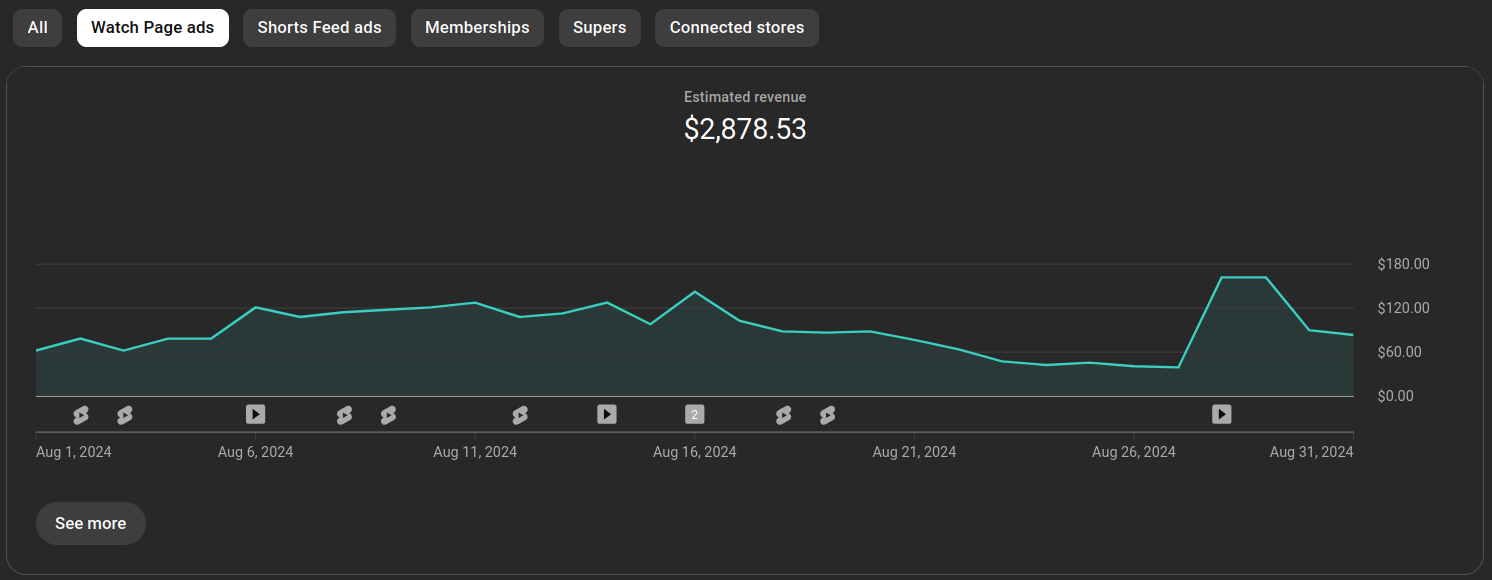
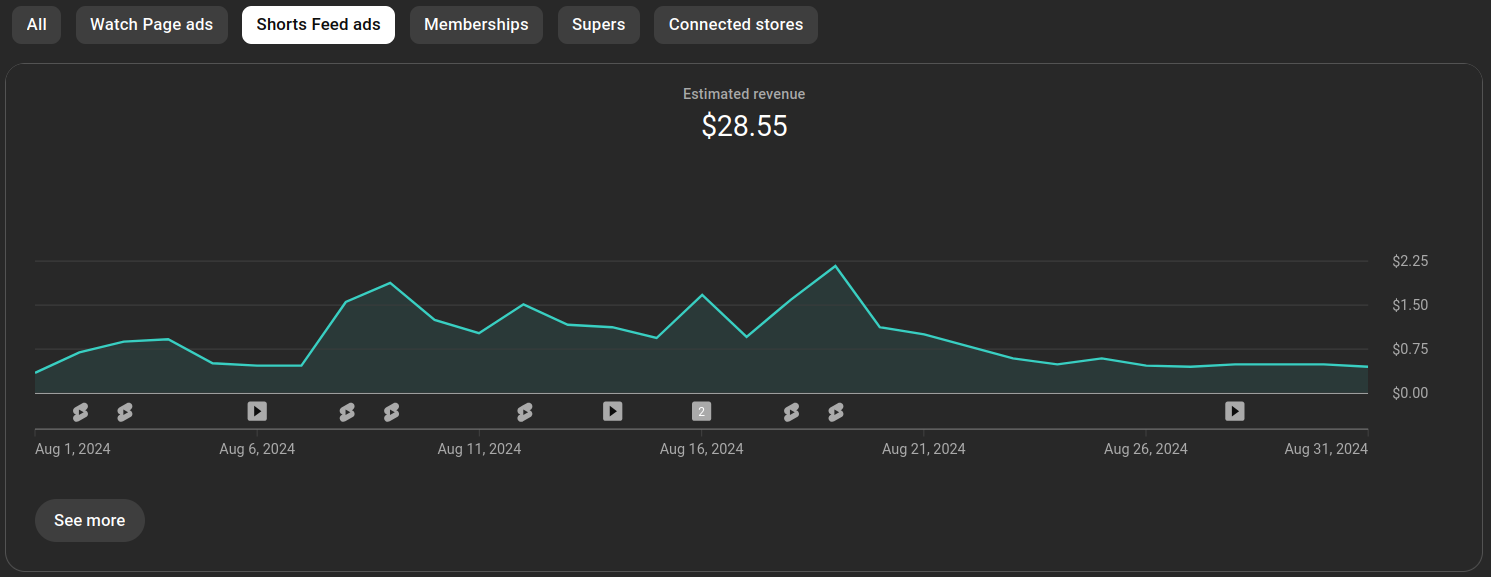
If you look at the first image here, which shows the "how much you're earning" tile, you can clearly see how much YouTube revenue fluctuates. I already know that September is likely to see significantly lower revenue compared to August, due to the general decline in interest in Godly Tombs and lower interest in Gore Tusk. However, this gives me the runway to work on another big project. It’s a different kind of grind compared to what I was doing before, and it’s taking some getting used to. Revenue will fluctuate more, but I hope it will turn out well in the end.
Additionally, revenue on YouTube tends to be better in the winter and worse in the summer. Late August marks the beginning of an increase in ad revenue due to the ramp-up for Black Friday and the holiday season.
If you appreciate this level of transparency, let me know in the comments. I would also like to share Twitch stats, but they are much more restrictive about what I can and cannot show. I might do it anyway at some point, but a few rules at Twitch need to change first. Some of them already have, we'll get there soon I think. I'd be lying if I said that sharing like this does not scare me. It is a bit nerve demolishing to show ngl.
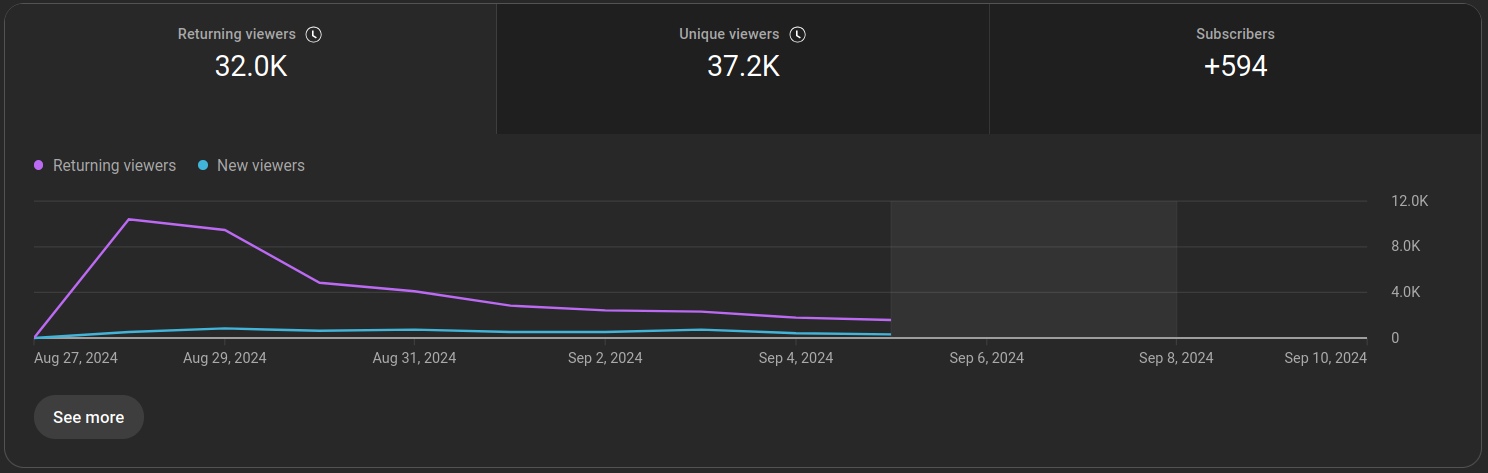
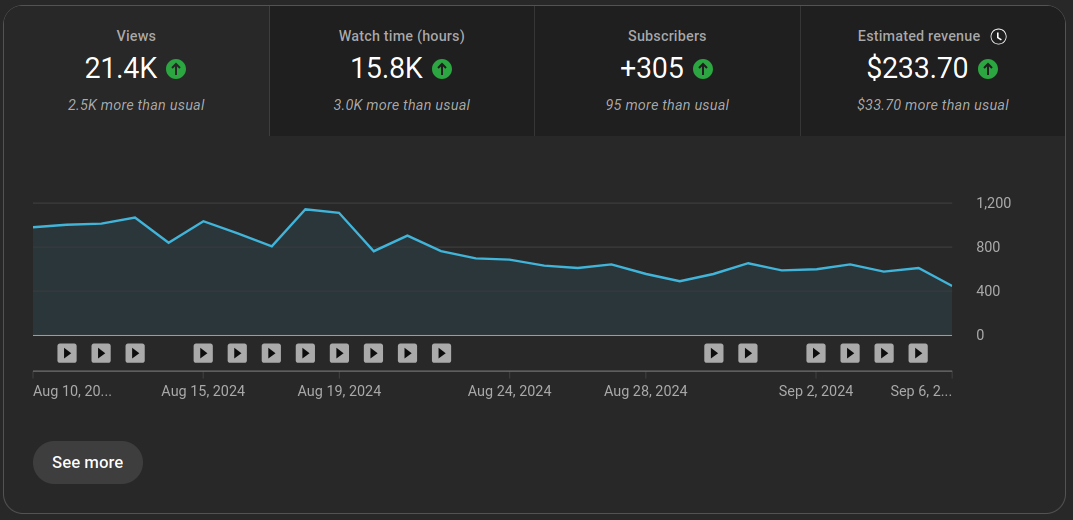
The last screenshot is the growth in the last 28 days on the VOD channel. Slow and steady folks. Slow and steady.
Alright! That is it for the month of August. Sorry for the wait, PAX took the wind out of me. Thank you so much for supporting this blog and helping me slowly become more independent.
Gregory.